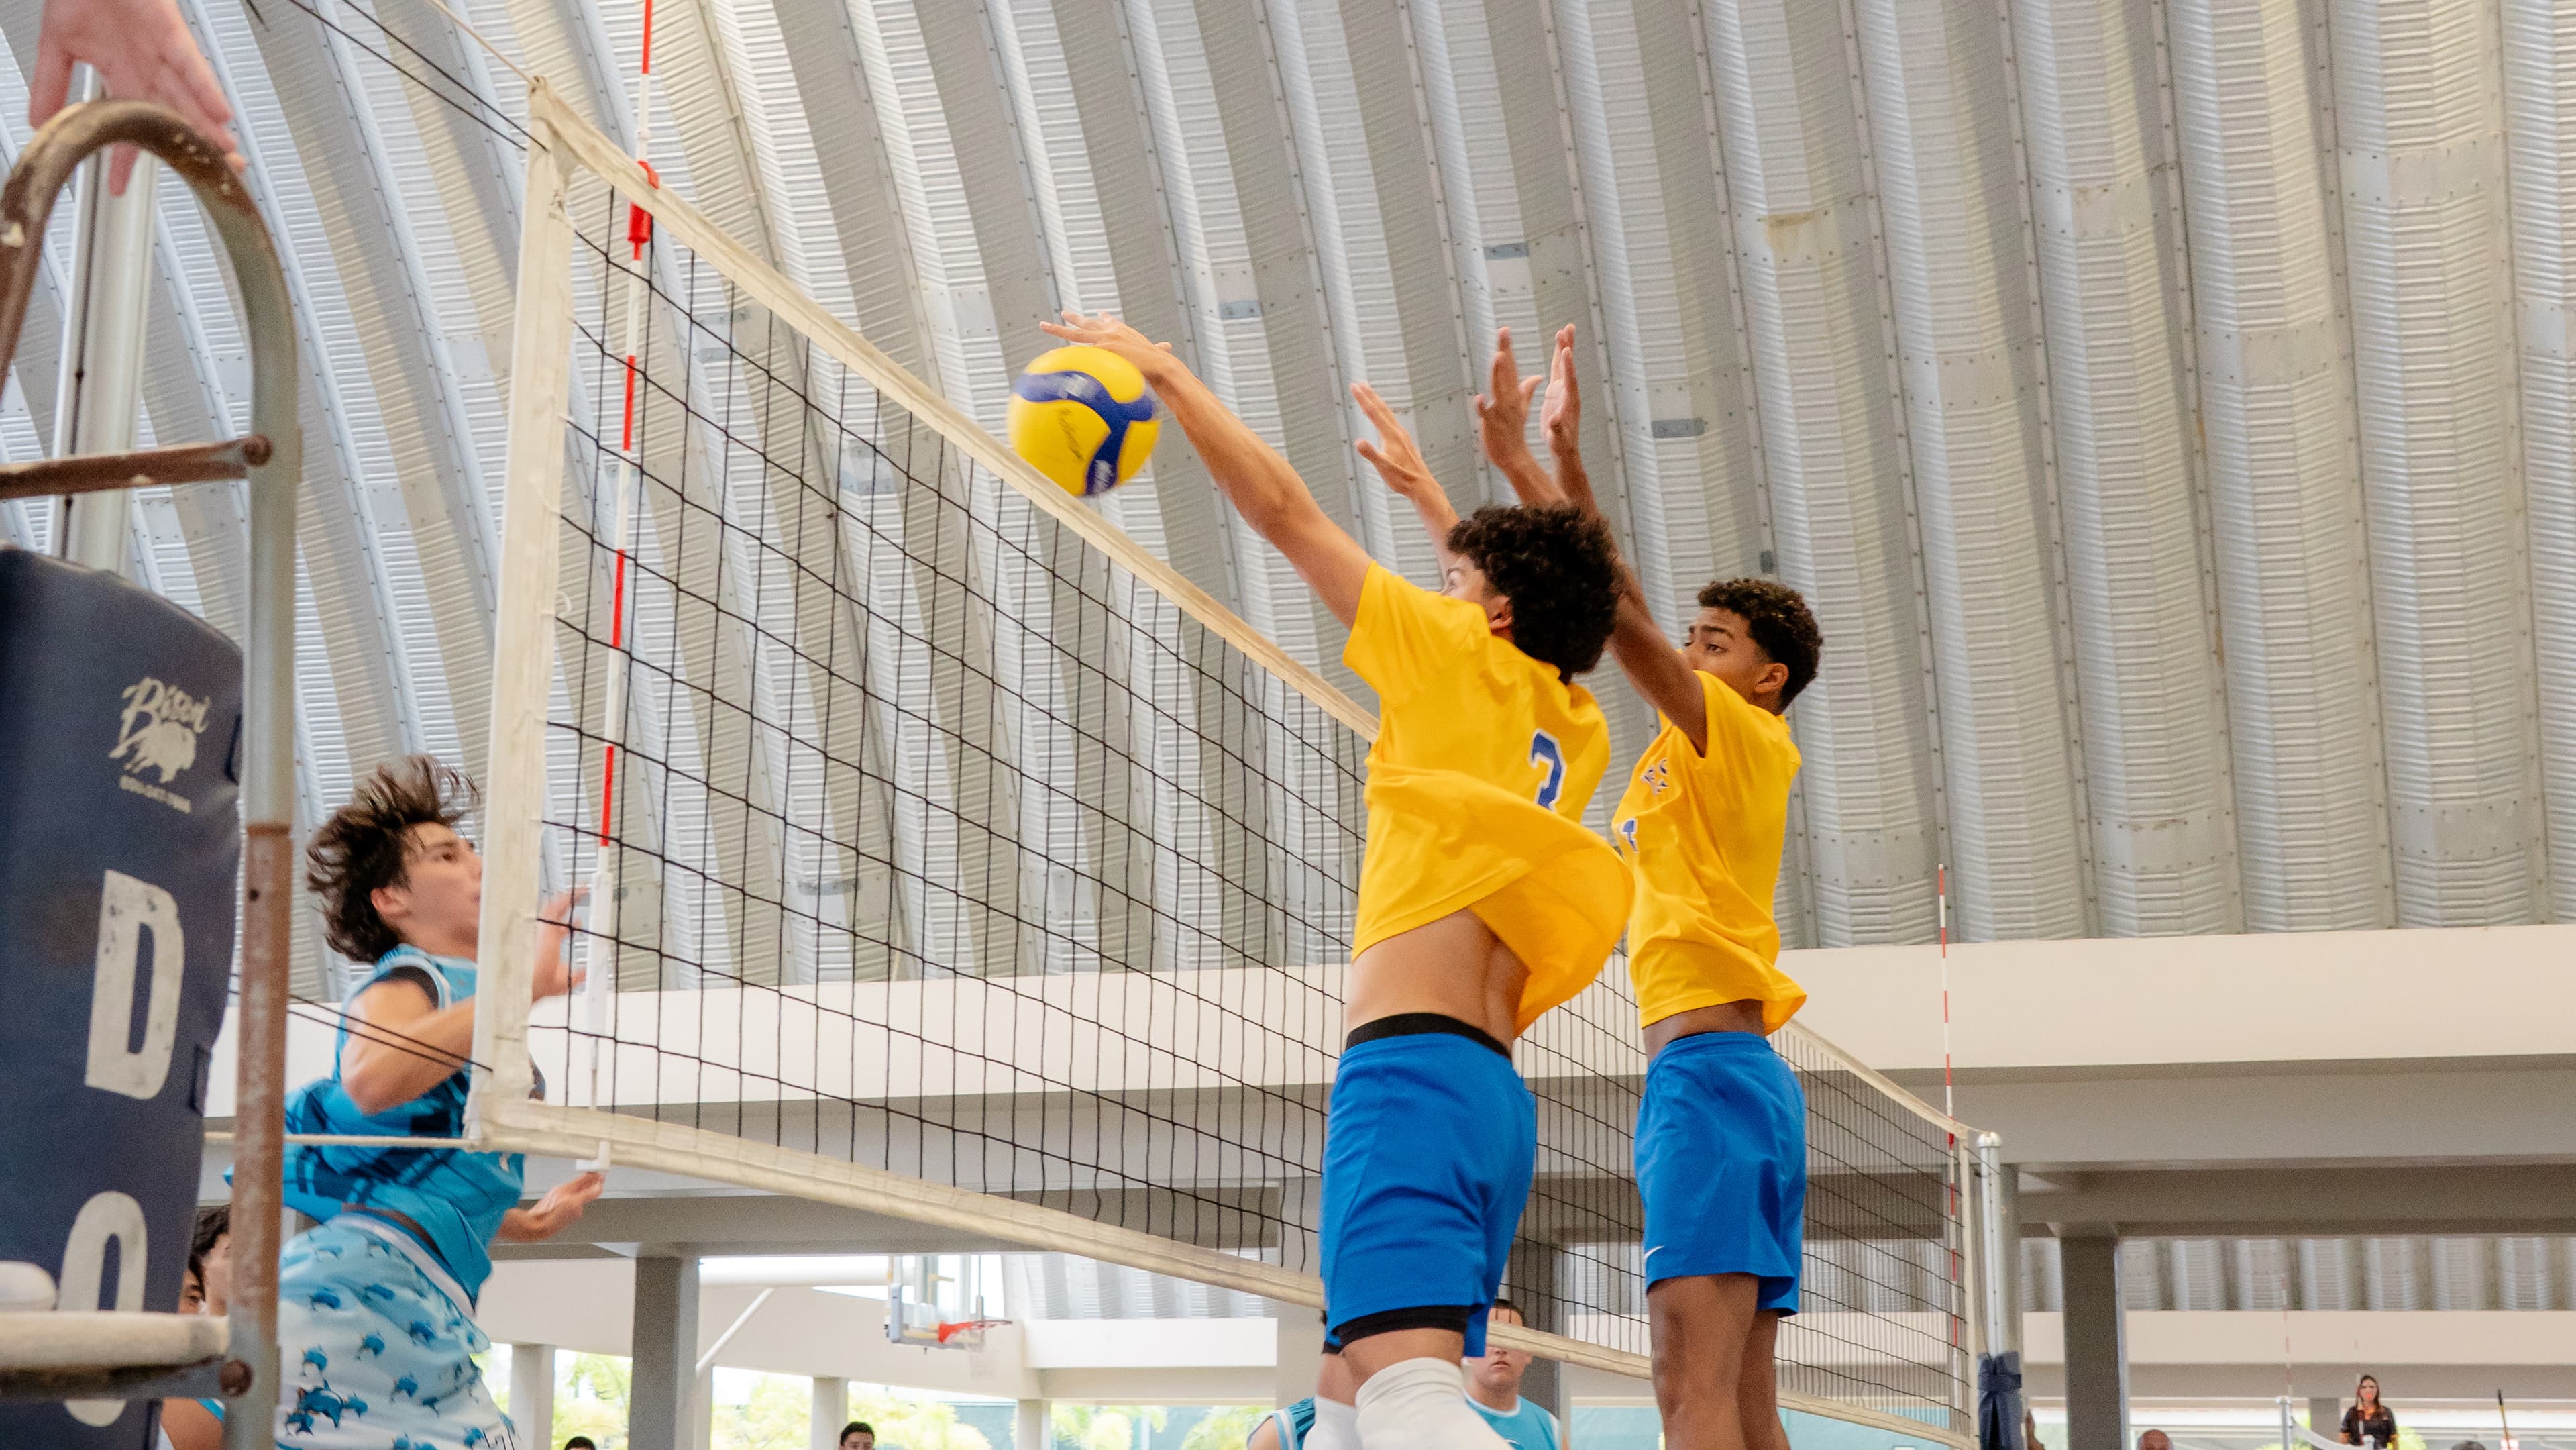
Every spike,measured.
Every attack clipped and measured automatically. Whole matches turned into heat maps and play counts. Nothing tagged by hand.
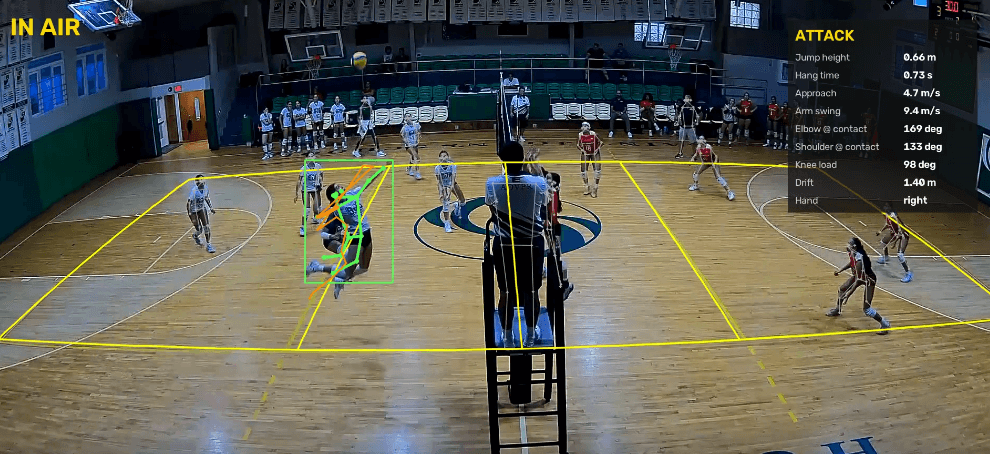
Every attack,clipped and measured.
Each spike lands in the console as its own clip the moment it is detected, with the measurements behind it.
Jump
- Jump height
- Hang time
- Takeoff and landing
- Drift
Approach
- Approach speed
- Approach angle
Arm
- Wrist speed at contact
- Elbow at contact
- Shoulder at contact
Body
- Load depth at the knee
- Torso lean at contact
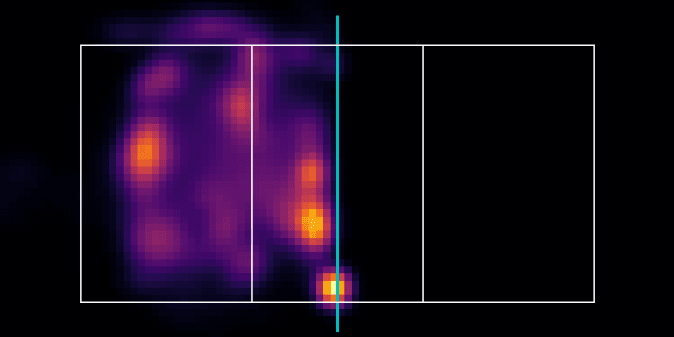
Whole matches,read back.
Match video goes in. Out comes where your team played, how long it spent in each zone, and every attack, block and jump serve, each linked to its clip.
League match, home
Full match analyzed from video
Pixels resolvedto real meters.
Finalvision finds every player, maps them onto the real 18 by 9 meter court, and measures what happened there. That is what makes a highlight comparable week to week.
From footage to the bench
5 of 6 stages running- LiveCaptureCourt-side devices, or match video you already have
- LivePose and trackingEvery player, frame by frame
- LiveCourt referencingPixels resolved to real meters
- LiveMeasureEach attack, block and jump serve
- LiveConsoleClips, analysis, schedule, brackets
- BuildingRotation analysisScoring and side-out by rotation
The court,to scale.
Positions from the court-side devices, drawn on a regulation court while the set is running. In beta while we tighten accuracy with the teams using it.
- Geometry
- 18 × 9 m, net at 2.43 m
- Source
- Court-side devices
- Stored
- Nothing, streamed only
The whole season,in one place.
Schedules, results, rankings and the tournaments you host sit next to the video. Schools run every squad from one dashboard, under their own logo and colors.
Your school
Every squad, one manager
- VGVarsity Girls2 coaches
- JGJV Girls1 coach
- VBVarsity BoysNo coach yet
Invitational
Hosted by your program
Coming up
Schedule and match log
- Thu6:30League matchHomeMatch
- Sat9:00InvitationalPool play, day 1Tournament
- Mon4:00PracticeServe receivePractice
What runs today,and what is next.
Live means teams use it now. Beta means it works and is still being refined. Building means it is on the way.
- Spike clips and measurementEvery attack clipped with its metricsLive
- Match analysisHeat map, zone shares, play counts and clipsLive
- Match logResults with the spikes captured during each matchLive
- Schedule, rankings and tournamentsPublic bracket links for events you hostLive
- Schools and brandingOne manager for every squad, your logo and colorsLive
- Court viewPositions on a to-scale court, streamed liveBeta
- Rotation analysisScoring and side-out by rotationBuilding
| Feature | What it does | Where | Status |
|---|---|---|---|
| Spike clips and measurement | Every attack clipped with its metrics | Console | Live |
| Match analysis | Heat map, zone shares, play counts and clips | Console | Live |
| Match log | Results with the spikes captured during each match | Console | Live |
| Schedule, rankings and tournaments | Public bracket links for events you host | Console and web | Live |
| Schools and branding | One manager for every squad, your logo and colors | Console | Live |
| Court view | Positions on a to-scale court, streamed live | Bench and console | Beta |
| Rotation analysis | Scoring and side-out by rotation | Console | Building |
See it onyour team.
Request access and we will set up your program and your staff.